Use the Studies Dashboard to create and manage your studies in one central location before deploying them in Captivate.
To open the Studies Dashboard:
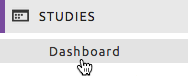
- Navigate to STUDIES > Dashboard.
- The Studies Dashboard opens, showing the studies you created and those shared with you.
- If necessary, the studies dashboard can be filtered by Sponsor.

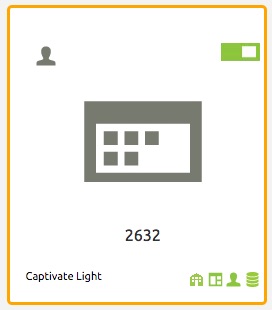
- Each study is represented by an icon with the following artifacts. Referring to the artifact numbers in red below:

- Indicates wherever or not a study is shared. If it shared, the artifact shows a group of people, otherwise, it is a single person. Click it to add or revoke shared access. Hover your mouse to see the list of people sharing the study and their access level.
- If this artifact is green, it indicates your study is deployed and you can click it to access the Captivate instance hosting your study. Hover your mouse to see the URL. If it is grey your study is not deployed. If it is red, your study exceeded some usage metrics. for example your plans allows for 10 sites but 12 are defined.
- This is the study name. Hover the mouse over it to reveal the sponsor name.
- This is the current study plan. You can upgrade the plan by editing the study.
- These icons represent the usage metrics related to a deployed study. They are, from left to right:
- Number of sites
- Number of CRF pages
- Number of users
- Storage used.
Notes:
- Usage icons are normally green but turn orange if usage exceeds 75% and red if usage exceeds 90%. See Monitoring Usage for details.
- Study metrics are updated once daily.
- The currently selected study is higlighted with an orange border.